

Appearance
Reports
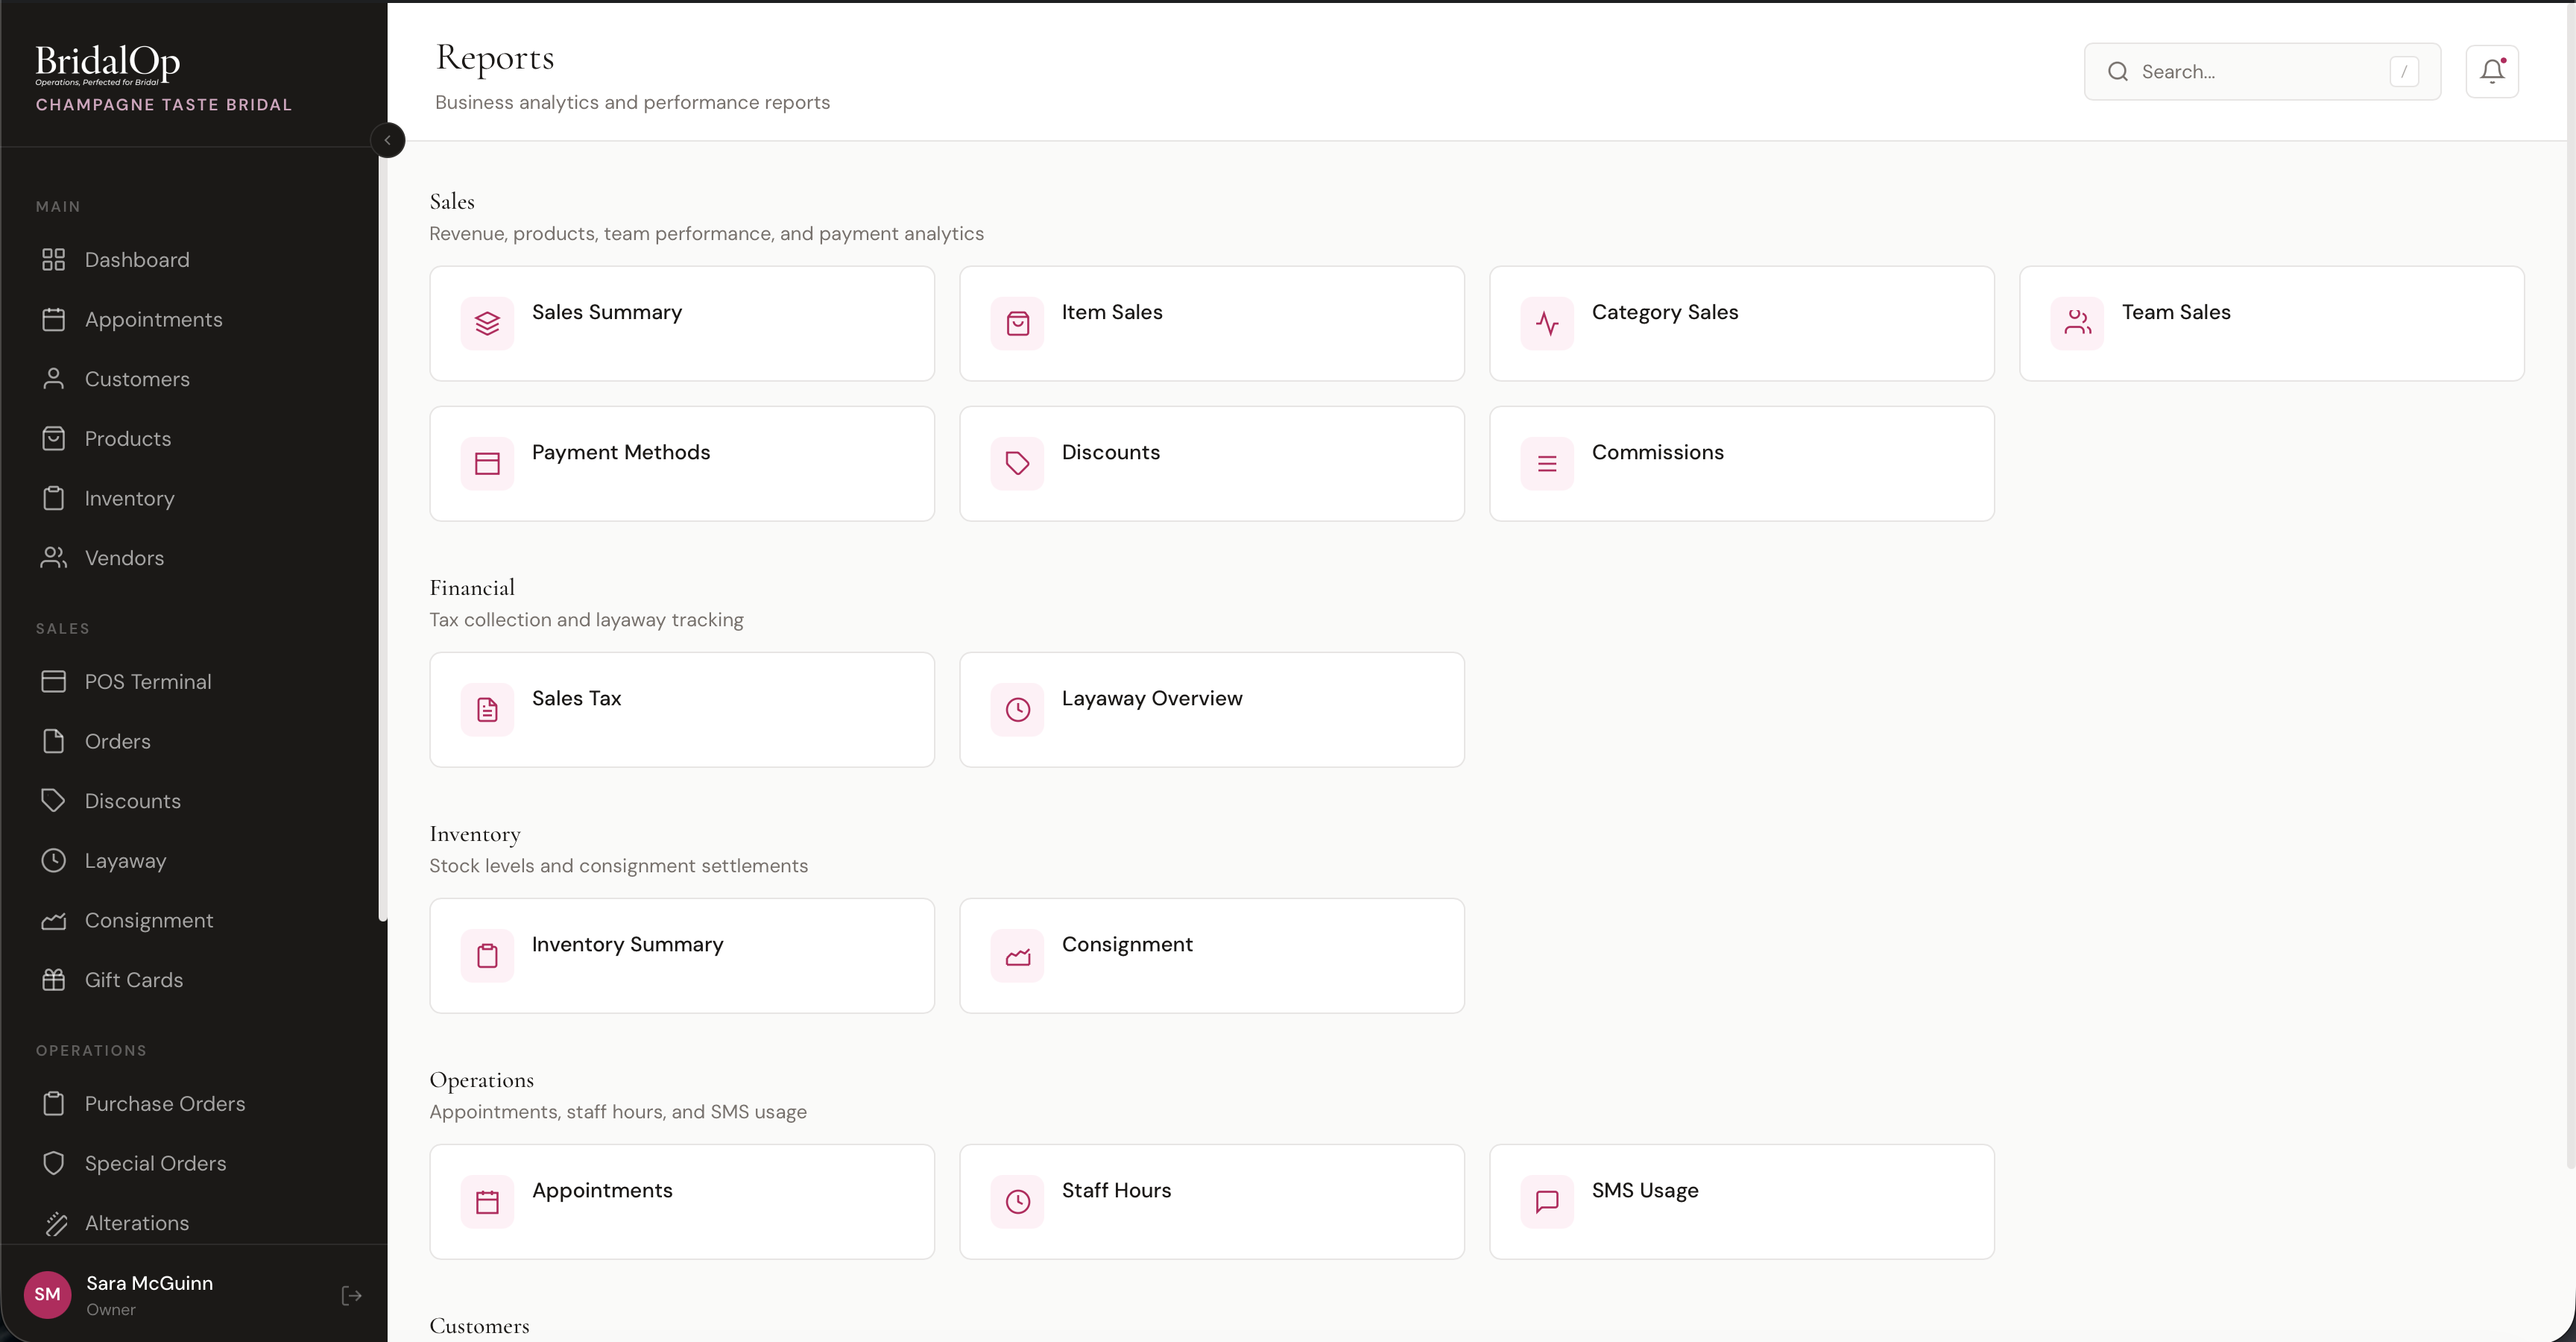
BridalOp ships a Sales Dashboard landing page plus 20 built-in reports across five categories, and an AI assistant called Bri that can answer questions about your business data in plain English.
Revenue is reported net of sales tax
Across every report, revenue figures exclude sales tax collected. Tax you collect is a liability you remit to the state, not income — so it never counts toward your revenue, gross margin, commissionable sales, or dashboard KPIs.
Sales Dashboard
The Sales Dashboard at /reports/sales-dashboard is the executive landing page — every number that matters in one screen. A featured card pinned to the top of /reports and a quick-link card on the home Dashboard both link straight to it.
The dashboard renders seven KPI tiles. Every tile is clickable and drills into the underlying report pre-filtered to the same period:
| Tile | What It Shows |
|---|---|
| Revenue This Month | Month-to-date revenue with a delta vs the prior month |
| Revenue This Quarter | Quarter-to-date revenue with a delta vs the prior quarter |
| Revenue Year-to-Date | YTD revenue with a delta vs the prior year |
| Appointments Booked | Appointment count this month |
| Close Ratio (Bridal Gowns) | Bridal gown close ratio with a weekly sparkline trend |
| Gross Margin by Department | Bar chart of revenue + gross margin across product types |
| Highest Margin Categories | Top 5 categories ranked by margin |
Use the dashboard as your morning check-in: glance at the row of KPIs, click whichever number deserves a deeper look.
Sales
| Report | What It Shows |
|---|---|
| Sales Summary | Total revenue, order count, average order value, tax collected, and discounts given. Includes a revenue trend chart and breakdown by order type. |
| Item Sales | Every product sold in the period with quantity, revenue, average price, cost, and profit margin. Sortable by any column. |
| Category Sales | Sales aggregated by product category — items sold, revenue, average price, percentage of total revenue, COGS, Gross Margin, and Margin %. |
| Department Margin | Gross margin grouped by product type (Gowns / Bridesmaid / Accessories / Veils / Shoes / Alterations / Other) — KPI tiles, bar chart, and table. |
| Sales by Vendor | Revenue, cost and gross margin per designer, with every item that designer sold underneath it. |
| Appointment Offers | Staff offer codes on appointment fees — times used, whether those appointments were kept, and what the discounts cost. |
| Prom Season | Prom exclusivity for the season — sales by school, most spoken-for styles, and every override. Requires the Prom module. |
| Tux Rentals | Rental revenue with weddings and prom split out, what's still out, what you recovered on late and missing pieces, and volume by supplier. Requires the Suit & Tux Rentals module. |
| Close Ratio | Bridal-appointment-to-gown-sale conversion ratio over a configurable window, broken out by store and per-consultant. |
| Team Sales | Staff performance — orders closed, items sold, revenue, and average order value per team member. |
| Payment Methods | Transaction count and total amount per payment method (cash, card, gift card, etc.) with percentage breakdown. |
| Discounts | Every discount used in the period — name, code, type (percent/fixed), usage count, and total amount given. |
| Commissions | Commission earned per staff member based on their commission rules and total sales closed. |
Department Margin
The Department Margin report at /reports/department-margin answers a single question: which product types are actually making you money?
Two KPI tiles up top — Revenue and Gross Margin for the period — sit above a Revenue vs. Gross Margin by Department bar chart and a per-department table.
| Column | Description |
|---|---|
| Department | Product type (Gowns, Bridesmaid, Accessories, Veils, Shoes, Alterations, Other) |
| Units Sold | Quantity sold across all line items in the department |
| Revenue | Net revenue (after discounts) |
| COGS | Cost of goods sold — sum of unit_cost × quantity |
| Gross Margin | Revenue minus COGS |
| Margin % | Gross margin as a percentage of revenue |
Margin numbers don't drift
Each line's unit_cost is snapshotted at sale time, so historical margin won't shift later when you update a product's cost. Existing orders use a backfill from the inventory item's purchase price (or, falling back, the product's cost plus any per-variant additional cost) so day-one numbers are solid too.
Sales by Vendor
At /reports/vendor-sales. Which designers actually make you money — not the same question as which designers sell.
A line can turn over beautifully at a thin margin and be worth less to you than a slower one you buy well. You want to know that at the buying appointment, not six months after signing the order.
Five tiles across the top (vendors, revenue, cost, gross margin, margin %), a Revenue vs. Gross Margin bar chart of the top twelve vendors, then the table. Click any vendor row to expand it and see every item they sold, each with its own units, revenue, cost and margin.
| Column | Description |
|---|---|
| Vendor | The designer, plus how many of their items sold |
| Units | Quantity sold across all their items |
| Revenue | Net revenue after discounts |
| Cost | What those items cost you |
| Gross Margin | Revenue minus cost, in dollars and as a percentage |
Margin percentages are colour-coded — green at 50% and above, amber below 35% — so a thin line stands out without you having to read every number.
An item with no cost reads as 100% margin
If a sold item had no cost recorded, its revenue counts and its cost is zero, which makes the margin look perfect. The report tells you how many units that applies to in an amber banner, and marks the affected items with an asterisk.
Check that banner before acting on a surprisingly good vendor. The fix is to put costs on the products; margin is snapshotted at sale time, so it corrects for future sales rather than rewriting past ones.
Private-label items appear with their name but without their style number — this report tends to get read in front of the very rep it would disclose it to.
Close Ratio
The Close Ratio report at /reports/close-ratio measures how often a bridal appointment turns into a gown sale within a configurable window after the appointment.
| Filter | Options |
|---|---|
| Consultation Types | Checkboxes for every appointment type you offer. Tick exactly which ones count as bridal consultations. Use All types to select or clear them all. |
| Counts As A Sale | Checkboxes for the kinds of product you actually stock, with a count of each. Defaults to Bridal Gown. |
| Conversion Window | 14 days, 30 days (default), 60 days, or 90 days after the appointment |
| Group By | Week or Month (store rollup view only) |
Pick your own consultation types
Boutiques often run more than one bridal consultation type — say a Classic Bridal Appointment plus a Bubbly Appointment — and any of them can end in a gown sale. The Consultation Types filter lets you choose exactly which appointment types count, so no real consultations (or the closes they earned) get dropped. Leave the boxes as they load and BridalOp counts every appointment type whose name reads as bridal; tick your own set to override that default.
Not every appointment closes on a gown
Until you change it, the report counts a bridal gown and nothing else. That's right for a bridal consultation and wrong for everything else a boutique runs — an evening-wear appointment that ends in a formal purchase would read as a miss, and so would an alterations appointment. Pair Counts As A Sale with Consultation Types and you can read each kind of appointment fairly: evening wear closing on formal, alterations on alterations.
Clearing every box falls back to bridal gowns rather than silently meaning it.
There are two views:
- Store rollup — period-over-period close ratio for the whole boutique. Columns: Period, Appointments, Closes, Close Ratio, Gown Revenue.
- Per-consultant — same metrics, but per consultant. Columns: Consultant, Appointments, Closes, Close Ratio, Gown Revenue.
Dedup rule: each sale credits at most one appointment — the earliest qualifying one. So when a bride comes in for two consultations before buying, the close ratio doesn't get inflated by the repeat visit. The number stays honest.
Because of that rule, ticking more kinds under Counts As A Sale won't necessarily lift your ratio. It picks up appointments that closed on something other than a gown; it doesn't double-count the ones already closing on gowns.
Team Sales
The Team Sales report at /reports/team-sales credits every completed order to a seller and rolls up orders closed, items sold, revenue, and average order value per team member.
Each sale is attributed to its assigned salesperson, falling back to whoever rang it up if no one was assigned. That means a sale credited to a seller shows up under their name — not lumped into Unassigned — and matches how the same sale is credited on the Commissions and Close Ratio reports.
Commissions
The Commissions report at /reports/commissions shows commission earned per staff member for the period. Commission amounts are snapshotted at sale time, so they don't shift later when you change a rate.
| Column | Description |
|---|---|
| Staff Member | The seller who earned the commission |
| Rate | The effective rate actually applied to their sales for the period |
| Orders Closed | Distinct orders that earned commission |
| Total Sales | Their commissionable sales (net of tax), counting each order once |
| Commission Earned | Total commission dollars earned |
Commission rates resolve from most specific to most general: a rule for a specific seller and category, then that seller's default, then a category-wide rule, then a tenant-wide rule that applies to every seller and category (for example, "2% on all sales"). A tenant-wide rule is honored even when you've set no per-seller rates.
Rate and Total Sales stay honest
The Rate column reflects the rate genuinely applied to each seller's sales rather than a stored default, so a boutique running a single shared rule still sees the real number instead of "Not set". Total Sales counts each order once even when it has several commissionable lines, so a multi-item sale is no longer double- or triple-counted.
Appointment Offers
/reports/appointment-offers
How your staff offer codes are performing.
| Column | What it tells you |
|---|---|
| Used | How many bookings the code was applied to. |
| Kept / Cancelled | Whether those appointments actually happened. |
| Kept % | The number worth acting on. |
| Given Away | What the discounts cost you. |
| Collected | What you still took, after the discount. |
Used is the headline, Kept % is the answer
An offer that books ten appointments and loses seven is worse than one that books three and keeps all three. A generous code that fills the diary with cancellations is an expensive way to look busy — the Kept column is what tells you which offer to use on the next round of calls.
There's also a By Staff Member breakdown. One person applying nearly all of them usually means the rest of the team doesn't know the codes exist.
Tux Rentals
Available when the Suit & Tux Rentals module is on. /reports/rentals
Four questions in one report, because you tend to ask them together.
| Section | What it tells you |
|---|---|
| Revenue | What hire brought in, with parties, people and revenue per person — and weddings against prom, since both run off the same module. |
| What's still out | Every garment not yet back, with what your supplier would bill you if none of it came back. Ignores the date range on purpose — "what haven't I got back" is a question about right now, not last month. |
| Charged for late and missing | What you actually raised for late returns and pieces that never came back. |
| Where the business went | Pieces, parties and people per supplier. What you take into a conversation about terms. |
The number worth watching
The recovery section flags pieces marked as never returned with no charge raised against them. That is almost never generosity — it's the return checklist being ticked straight through on a busy Saturday. Your supplier still bills you for every one of them.
Prom Season
Available when the Prom module is on. /reports/prom
How the season is holding up: dresses sold, schools covered, prom revenue, holds still live and holds lapsed — plus the most spoken-for styles, and every override with the reason given.
| Section | What it tells you |
|---|---|
| By School | Where your prom business comes from. A school with three girls and no marketing behind it is usually the cheapest one to grow. |
| Most Spoken-For Styles | A dress taken at six schools is one to reorder — exclusivity means each school can only ever give you one sale of it, so popular styles need breadth, not depth. |
| Overrides | Every dress sold over the top of an existing registration. Most will be perfectly good; a run of thin reasons is the promise quietly coming apart, and this is the only place it shows. |
| Season Over Season | Whether prom is growing. |
This report ignores the date range
It's scoped to the season, not the dates at the top of the page — a dress registered in November belongs to the spring it was bought for, and date-ranging it would show you an empty report in the middle of prom season. It isn't split by location either: exclusivity belongs to the school, so a per-branch split would be a lie.
The CSV export gives you the by-school breakdown.
Financial
| Report | What It Shows |
|---|---|
| Sales Tax | Taxable sales, tax collected, and tax rate — broken down by location and by month. |
| Layaway Overview | Active, completed, and overdue layaway plans with outstanding balances and next payment due dates. |
| Inbound Expenses | Vendor purchase order expenses with outstanding balances. Shows what you owe vendors, when payment is due, and total balance due grouped by month. Includes vendor, PO number, product, customer, estimated arrival, payment terms, paid amount, balance due, and due date. Exportable as CSV or PDF. Supports threshold alerts (see below). |
Awaiting Pick-up
At /reports/awaiting-pickup. Everything sitting in your shop with a customer's name on it.
Two things end up on this list:
- Special orders that have arrived and haven't been collected — received, in alterations, or ready
- Alterations that are finished and haven't been handed over
It's sorted by how long each has been waiting, longest first, because that's the order you'd work the phone in.
This one ignores the date filter
It's a live snapshot of what's in the shop right now, not a summary of a period. A gown that arrived in March and is still on your rail in August is exactly the row you need — and a report bounded by "this month" would hide it.
Five tiles flag the ones that matter:
| Tile | Why it's there |
|---|---|
| Waiting | The count, split between special orders and alterations |
| Retail Value | What the rail is worth. Usually larger than people expect |
| 30+ Days | Amber when it's above zero |
| Wedding ≤ 14 Days | Red. Her wedding is inside a fortnight and the gown is still with you |
| Never Notified | Special orders where nobody has told the customer it arrived |
The table gives you the customer with their phone number, what the item is, how long it's been waiting, her wedding date with a countdown, whether she's been notified, and the value. Waits of 30 days show amber and 60 days red. Customer names link straight through to their profile.
Where a special order has no arrival date recorded, the wait is measured from the last time the record changed and marked with an asterisk — an unknown wait still needs chasing.
Inbound Expenses — Threshold Alerts
The Inbound Expenses report includes a Threshold Alerts setting that notifies you when your projected monthly expenses get too high.
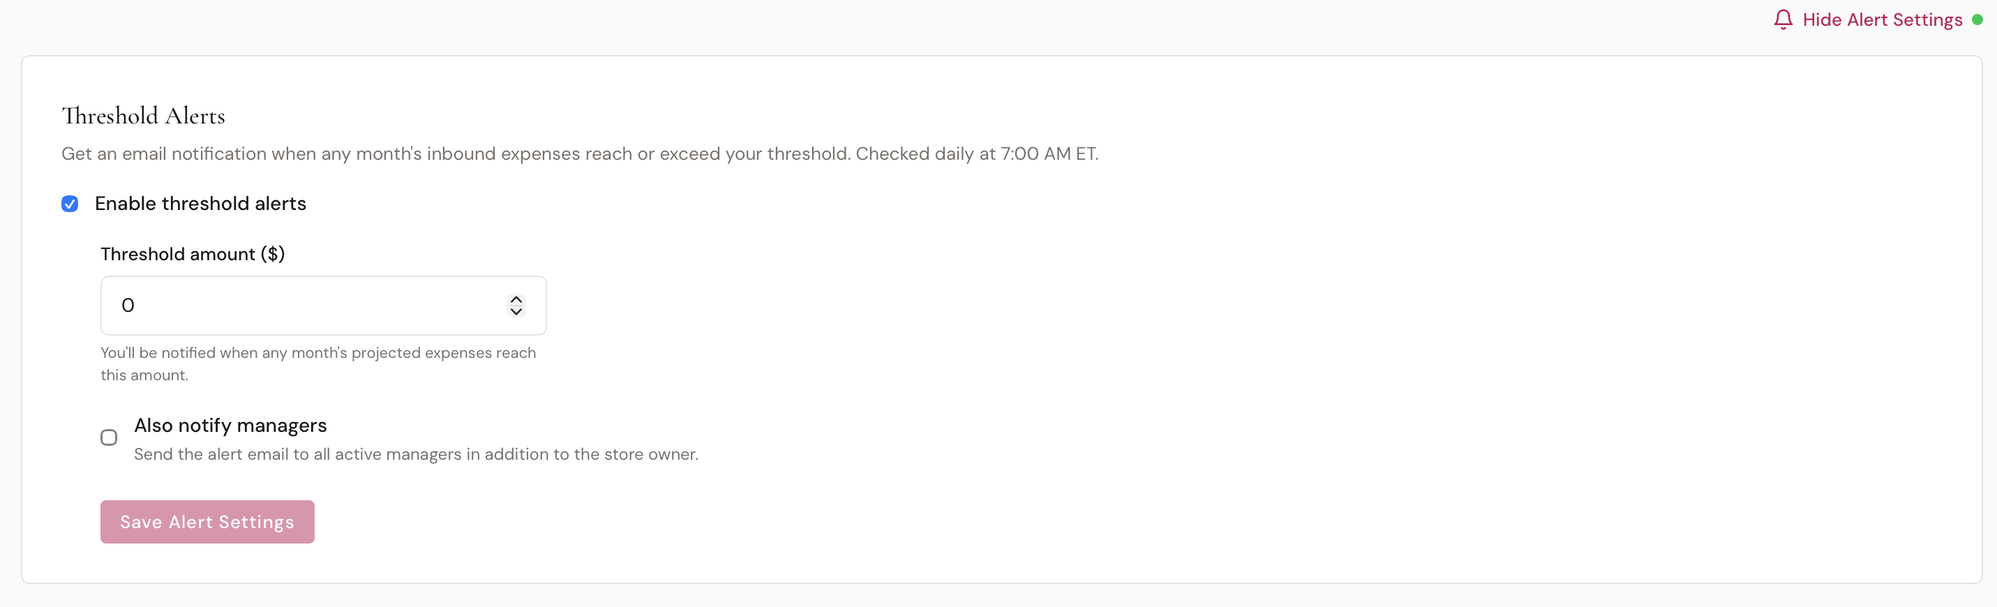
Click Alert Settings in the top-right corner of the Inbound Expenses report to configure:
| Setting | Description |
|---|---|
| Enable threshold alerts | Toggle alerts on or off |
| Threshold amount ($) | You'll be notified when any month's projected expenses reach or exceed this amount |
| Also notify managers | Send the alert email to all active managers in addition to the store owner |
Alerts are checked daily at 7:00 AM ET. When your projected inbound expenses for the current month hit or exceed your threshold, BridalOp sends an email notification to the store owner (and optionally all managers).
Inventory
| Report | What It Shows |
|---|---|
| Inventory Summary | Total items, inventory value at cost, and counts by status (available, reserved, sold, on-order, damaged). Broken down by product with ownership type (store-owned vs. consignment). |
| Consignment | Items sold per consignment vendor, total sales, vendor payout, and your store's revenue share. |
Operations
| Report | What It Shows |
|---|---|
| Appointments | Appointments held, no-show count and rate, completions, average party size, and cancellations with a cancellation rate. Includes trend chart, breakdown by type and source, and per-consultant stats. |
| Staff Hours | Shifts worked, days worked, total hours, break time, and average hours per day — per staff member. |
| SMS Usage | Total messages sent, credits used, delivery rate, and failed count. Broken down by context (automated vs. bulk) with a daily trend chart. |
Cancelled appointments are counted on their own
Everything on the Appointments report — the totals, the trend, and the breakdowns by type, source and consultant — covers appointments that happened. Cancellations are reported as their own figure and a rate, and left out of the rest.
A cancelled appointment never has a consultant on it, so counting them used to pile them all into Unassigned and credit consultants with appointments they never ran. It also read the no-show rate low, because the cancellations padded the number it divides by.
No-shows still count. Somebody held that slot and didn't come; a cancellation gave the slot back.
Customers
| Report | What It Shows |
|---|---|
| Customer Insights | Total and new customers, repeat customers (2+ orders), upcoming weddings. Includes trend chart, acquisition source breakdown (walk-in, referral, social, Google), and event type distribution. |
| Sales by Zip Code | Traffic and sales grouped by the customer's zip code — new customers, appointments, orders, and revenue per zip, plus a chart of your top zips by revenue. |
Sales by Zip Code
The Sales by Zip Code report at /reports/sales-by-zip shows where your traffic and sales come from geographically. It groups everything by the customer's zip code so you can see which areas drive the most brides and the most revenue — useful for targeting local marketing.
Four KPI tiles up top total the period, above a Top Zip Codes by Revenue bar chart and a searchable per-zip table.
| Column | Description |
|---|---|
| Zip Code | The customer's 5-digit zip (ZIP+4 is collapsed to its base) |
| New Customers | New customers added in the period from that zip |
| Appointments | Appointments booked in the period for customers in that zip |
| Orders | Completed orders in the period |
| Revenue | Net revenue (after discounts, before tax) from that zip |
| % of Revenue | That zip's share of total revenue for the period |
Where zip comes from
Zip is read from the customer's saved address. Brides who booked online without a saved address roll up under Unknown until their address is filled in.
Filters
Every report supports a date range filter and most support a location filter. Select a custom range or use quick presets to narrow the data.
Totals
Report tables carry a totals line across the bottom.
It follows the search box — filter the table to one designer and the total is that designer's, not the whole report's. That makes it a quick way to answer "what did Allure do this month" without exporting anything.
It only adds up the columns where adding up means something. Quantity, revenue and cost are summed; Average Price and Margin % are recalculated from the totals rather than added together, because averaging a column of averages produces a number that looks right and isn't.
Currently on Item Sales and Category Sales.
Sales across two boutiques
Reports cover one account at a time — the separation is what keeps two boutiques' figures from ever mixing. If you run more than one, export the same report from each for the same date range: the columns are identical, so the two files drop straight into one spreadsheet.
Ask Bri
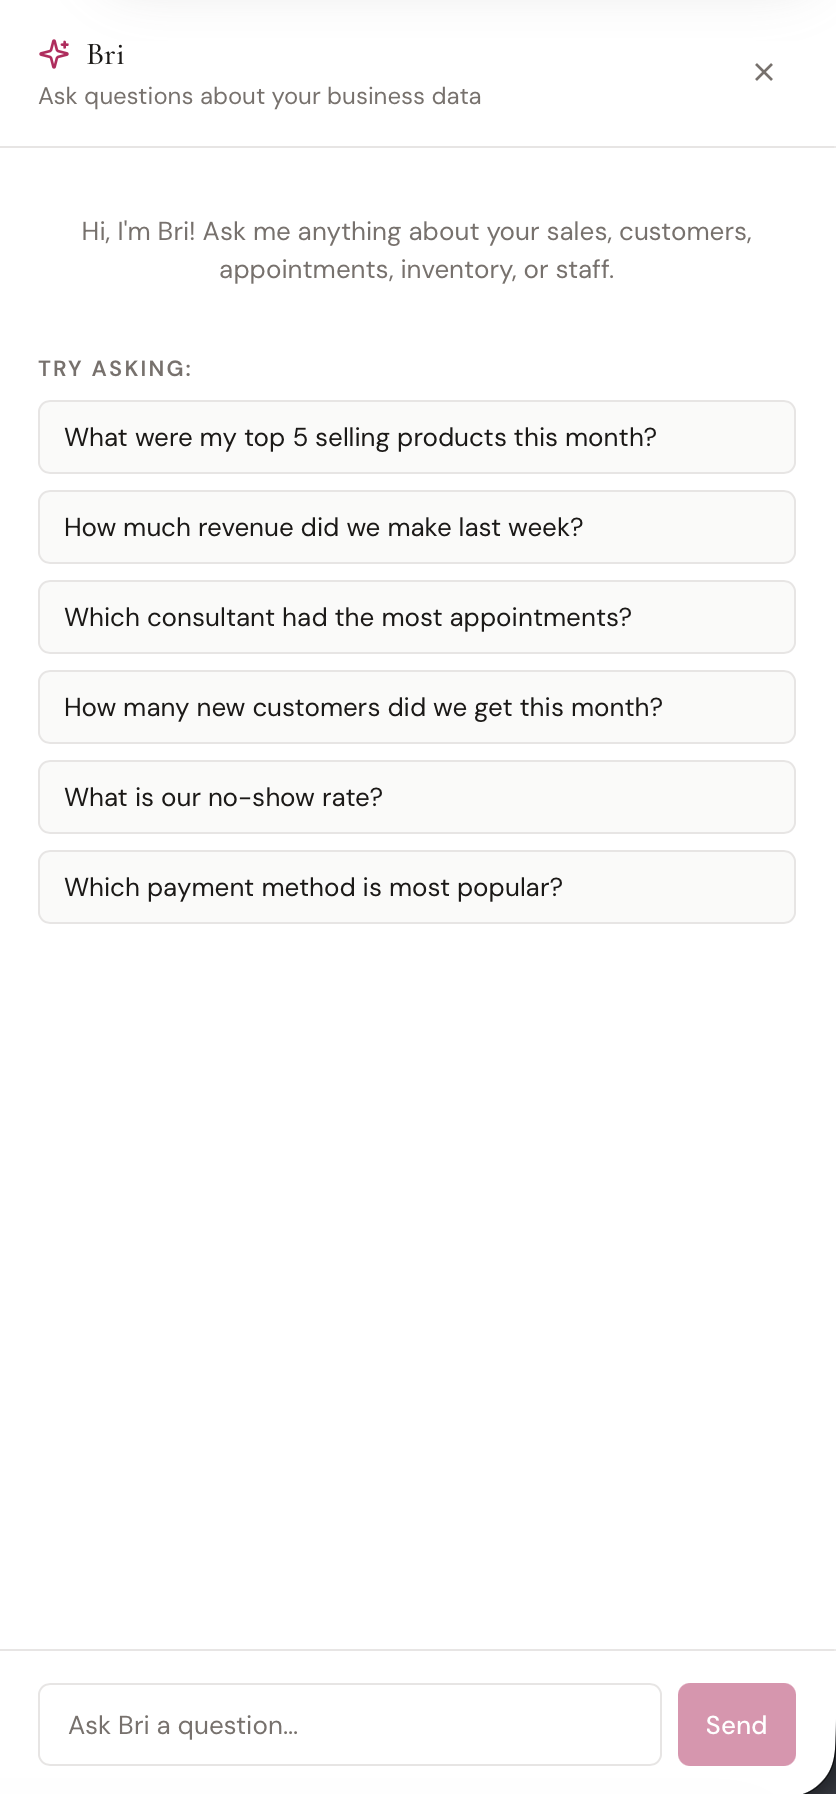
Bri is BridalOp's AI assistant — ask questions about your business data in plain English and get instant answers.
Opening Bri
Click the Ask Bri button in the top-right area of any report page. A chat panel slides open from the right side of the screen.
What You Can Ask
Bri has read-only access to your sales, customers, appointments, inventory, staff, and financial data. Ask anything you'd normally dig through reports for:
- "What were my top 5 selling products this month?"
- "How much revenue did we make last week?"
- "Which consultant had the most appointments?"
- "How many new customers did we get this month?"
- "What is our no-show rate?"
- "Which payment method is most popular?"
Click any suggested question to submit it instantly, or type your own.
How It Works
Type a question and press Enter or click Send. Bri analyzes your data and responds with a clear, formatted answer — dollar amounts, dates, and counts are all presented in readable form.
The conversation is maintained throughout your session, so you can ask follow-up questions. Your messages appear on the right in pink, and Bri's responses appear on the left.
Data Privacy
Bri only has read-only access to your boutique's data — it can never modify, delete, or share anything. Internal IDs and system fields are never exposed in responses. All queries are scoped to your account and rate-limited for security.